PVGIS production, official 2025 PTF, owner-directed Chinese-accelerator procurement at one-third of the prior H100 hardware proxy, and premium compute-service revenue throughout the selected project life.
Solar baselineS01
—Lifetime net cash
NPV at selected hurdle
—
IRR
—
Payback
—
Cash multiple
—
Profitability index
—
LCOE
—
Solar + data centerS02
—Lifetime net cash
NPV at selected hurdle
—
IRR
—
Payback
—
Cash multiple
—
Profitability index
—
Lifetime incremental capex
—
Energy architectureOPS
Solar generation year 1
—
Effective PUE
—
Cooling reduction
—
SOLAR RETURN CONTEXT
NPV is the value above or below the selected hurdle—not
lifetime profit.
Lifetime net cash—
IRR versus hurdle—
Comparison-horizon NPV
—
Calculating the solar return reconciliation…
HOW TO READ THE RETURNS
Absolute value and capital efficiency answer different questions.
NPV
How much discounted value is created, in dollars—not business size.
IRR
The annualized return implied by the timing of project cash flows.
Cash multiple
Lifetime net operating cash per dollar of capex, without discounting.
Profitability index
Discounted revenue per dollar of discounted total cost; above 1.00 creates value.
Payback
How long nominal cumulative project cash flow takes to recover investment.
Calculating the current return interpretation…
UNLEVERED CASH FLOW
Annual project cash flow
Solar onlyCoupledCapex event
Calculating the annual capital-event pattern…
STABILIZED ENERGY ROUTING
Potential hourly solar matching
—potential match
Potential direct
—
Billed grid export
—
Billed grid import
—
Hourly solar matching from a 2005–2023 PVGIS profile against a
flat compute load at the selected utilization after the
commissioning ramp. Only the approved direct-solar settlement
percentage changes billed import and export; the conservative
base is zero pending connection, metering, and legal approval.
Storage, curtailment, outages, and grid constraints are not yet
dispatched.
PVGIS 5.3 · KARADAG COORDINATE
Monthly solar production profile
PRIMARY DATA
—Annual mean
—At or below 20°C
—95th percentile
—Above 35°C
Fixed, optimally inclined crystalline-silicon system with 14%
system loss at 37.181° N, 33.222° E. Long-run PVGIS-SARAH3
estimate using 2005–2023 meteorological data. The 18% passive
cooling reduction is an owner-approved model basis. These
temperatures inform equipment sizing and minor operating
variation.
DECISION SNAPSHOT
What the model says now
Value created—
NPV scale ratio—
Potential direct solar share—
Settled direct solar share—
Physical utilization—
Billable utilization—
Avoided grid emissions—
Solar land area screen—
Evidence coverage—
Next investment gatePrice the excluded land, grid, tunnel, fee, and security scopes and obtain contractable sovereign-compute terms.
LIFETIME COMPUTE ECONOMICS
Premium compute revenue continues for the full project life.
Revenue ramps with commissioned capacity and continues in every
modeled operating year. There is no artificial compute-revenue
cutoff.
LIFETIME REVENUE
—
—
—revenue-producing years
Stabilized annual service revenue—
Nominal premium compute revenue in the stabilized ramp year.
Final-year service revenue—
Compute revenue remains active through the final selected year.
Lifetime service revenue—
Undiscounted service revenue across all modeled operating years.
Sovereign-services uplift—
Editable premium applied to every year of compute-service revenue.
Coupled project NPV—
Discounted lifetime result at the selected hurdle rate.
Türkiye public H100 comparator$544/kW-mo
Derived from the official 2026 TRUBA private-institution
tariff, minimum storage, TCMB FX, and DGX H100 maximum power.
It is capacity-limited public-service evidence—not a
Karadag price or proof of 120 MW availability.
Facility construction and active IT equipment use separate
evidence, operating costs, and replacement treatment.
Solar generation asset—
All-in screening allowance pending a reconciled split of plant, contribution, owner, land, grid, contingency, tax, and financing scope.
Protected facility—
Shell, electrical, mechanical, and the mountain premium—excluding active IT.
Active IT hardware—
Servers, accelerators, storage, and networking, using the owner-directed Chinese-hardware cost basis at one-third of the prior H100 proxy.
Gross target-build model capex—
Combined solar, protected-facility, and active-IT capital
before conditional incentives.
Lifecycle cost account
Operating, renewal, and tariff assumptions.
Recurring costs and replacement events remain separate
from the initial-build allocation above.
Commissioning ramp
—
Conditional HIT-30 AI hardware grant
—
Net target-build capex
—
Active IT refresh event
—
Refresh cycle
—
Facility renewal
—
Routine solar O&M
—
Solar land area screen
—
Variable grid stack
—
Solar export capture factor
—
Captured export price
—
Grid import timing factor
—
Time-adjusted grid energy
—
YEKDEM pass-through
—
Supplier / imbalance
—
Transmission incl. surcharge
—
Electricity-consumption tax
—
Approved direct-solar settlement
—
Fixed transmission tariff
—
Contracted grid demand
—
Annual fixed grid cost
—
Land price and legal rights, external utility works,
professional fees, abnormal groundworks, and financing remain
outside these inputs until project quotations are obtained.
ASSUMPTIONS LAB / LIVE MODEL
Stress the investment case.
Every control recalculates both scenarios. Values, including conditional incentive support, are illustrative screening assumptions.
DUE DILIGENCE / LIVE REGISTER
Risk before rhetoric.
Every key thesis is paired with an explicit uncertainty, owner action, and severity assessment.
—critical risks
—risks shown
20maximum score
Category
Risk
Score
Mitigation / next evidence
No risks match this filter. Clear the search to restore the register.
SOURCE PROVENANCE / REVIEWED 2026-07-30
Evidence ledger.
Primary inputs link back to their origin. Commercial assumptions remain visibly separated from sourced benchmarks.
No evidence records match this search.
PROJECT LANGUAGE
Financial glossary.
No glossary terms match this search.
MODEL BOUNDARY / VERSION 1.0
Transparent by construction.
01
Real asset cash flows
Unlevered, pre-tax cash flow in USD with staged commissioning, degradation, fixed USD/kW-year solar O&M, separate export-price escalation, two-stage PPA pricing, split facility and active IT costs, an explicit conditional grant on initial AI hardware only, fixed and variable grid charges, inverter replacement, and six-year active IT refresh cycles.
02
Comparable scenarios
The coupled case retains the same solar asset, adds protected compute infrastructure, consumes available solar, and exports the balance.
Screening use only.
This prototype is not investment, engineering, legal, security, or
procurement advice. Independent diligence and sourced market inputs
are required before a capital decision.
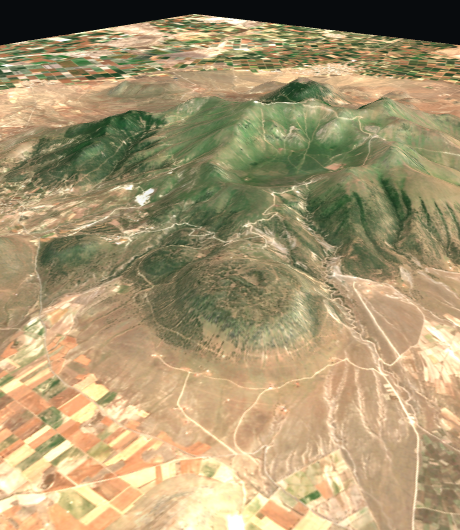 Explore the site
Karadağ in 3D
Explore the site
Karadağ in 3D